
2021-2022 Pacific Division Midseason Review

Despite significant disruptions due to the ongoing COVID-19 pandemic, the 2021-22 NHL season has officially reached its midpoint. Well, kind of. Game postponements due to COVID-19 have disproportionately impacted particular teams, which currently leaves certain teams having played at or above half of their games, while others have played less than half their games.
Crash The Pond has taken a multi-faceted approach to help summarize the season so far for each of the Pacific Division teams. We will look at the current standings in the Pacific Division, and then step through a variety of advanced metrics to guide our interpretation of the current standings, with a particular eye towards the Anaheim Ducks. Let’s get going!
Current Pacific Division Standings
The current Pacific Division Standings are shown in Figure 1 (below), as of Tuesday, January 25, 2022.

Based on raw point total (left panel), the Anaheim Ducks currently sit 2nd in the Pacific Division, and would square off against the Los Angeles Kings in a Playoff Freeway Face-Off if the postseason began today. However, due to the large disparity in games played (GP), we can instead look at the Pacific Division standings sorted by points percentage (right panel). This is a more accurate reflection of team performance thus far, and the Calgary Flames jump from 4th in raw point total to 2nd in point percentage. The Ducks drop from 2nd in raw point total to 4th in point percentage.
On Ice Metrics
Using the Pacific Division Point Percentage standings as a proxy for overall team results thus far this season, we can now utilize several advanced metrics to see if the actual results have been reflective of underlying team performance.
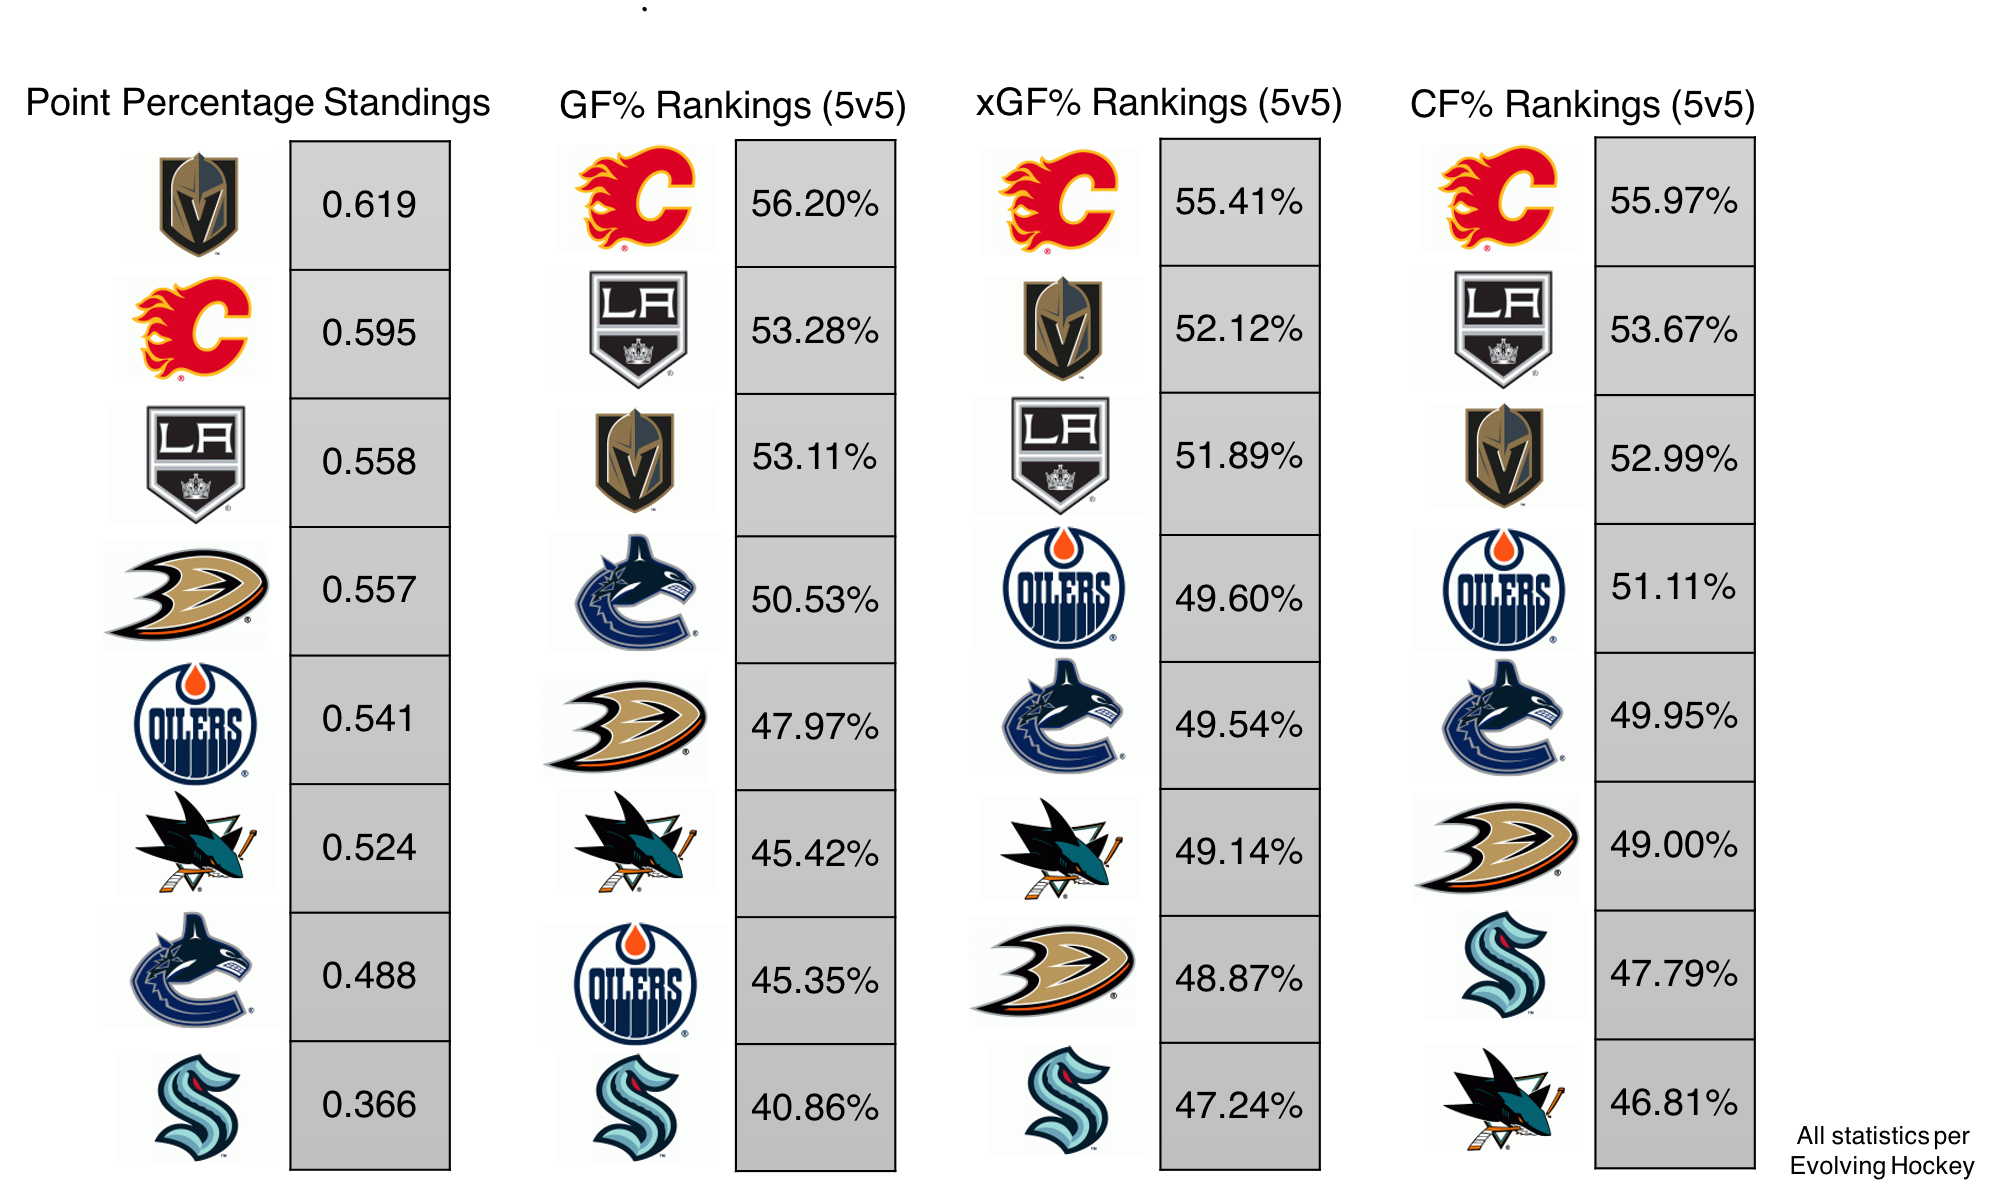
Figure 2 (above) once again shows the point percentage standings (left panel), and additionally shows Pacific Division rankings at 5v5 for Goals For % (GF%), Expected Goals For % (xGF%), and Corsi For % (CF%) (please see Evolving Hockey’s Glossary for more details on these metrics).
In comparing the standings in the left column to the team rankings in the subsequent three columns, we can ascertain the extent to which each team’s results can be explained by their underlying on-ice play. From the Anaheim perspective, they are currently 4th in the Pacific Division in points percentage, but rank 7th and 6th in xGF% and CF%, respectively. Also of note is that the Calgary Flames have been the best team in the division in both xGF% and CF%, but currently sit as only the last Wild Card team in the Western Conference Playoffs solely due to their having played the least number of games in the division.

Figure 3 (above) now examines both the results and the expected on-ice performance of each Pacific Division team’s powerplay so far this season. The left panel shows team powerplay rankings for GF/60 (i.e., the total number of powerplay goals each team has actually produced per 60 minutes), whereas the right panel shows team rankings for xGF/60 (i.e., the expected number of powerplay goals per 60 minutes for each team). If a team ranks higher (lower) in GF/60 than in xGF/60, then they have overperformed (underperformed) relative to expectation on the powerplay this season. From the Anaheim perspective, they rank 3rd in the Pacific Division in GF/60, but 8th (last) in the division in xGF/60. This suggests that the Ducks have benefited favorably from factors other than their own on-ice play on the powerplay this season (e.g., puck luck, subpar performance from opposing goaltenders, etc.).
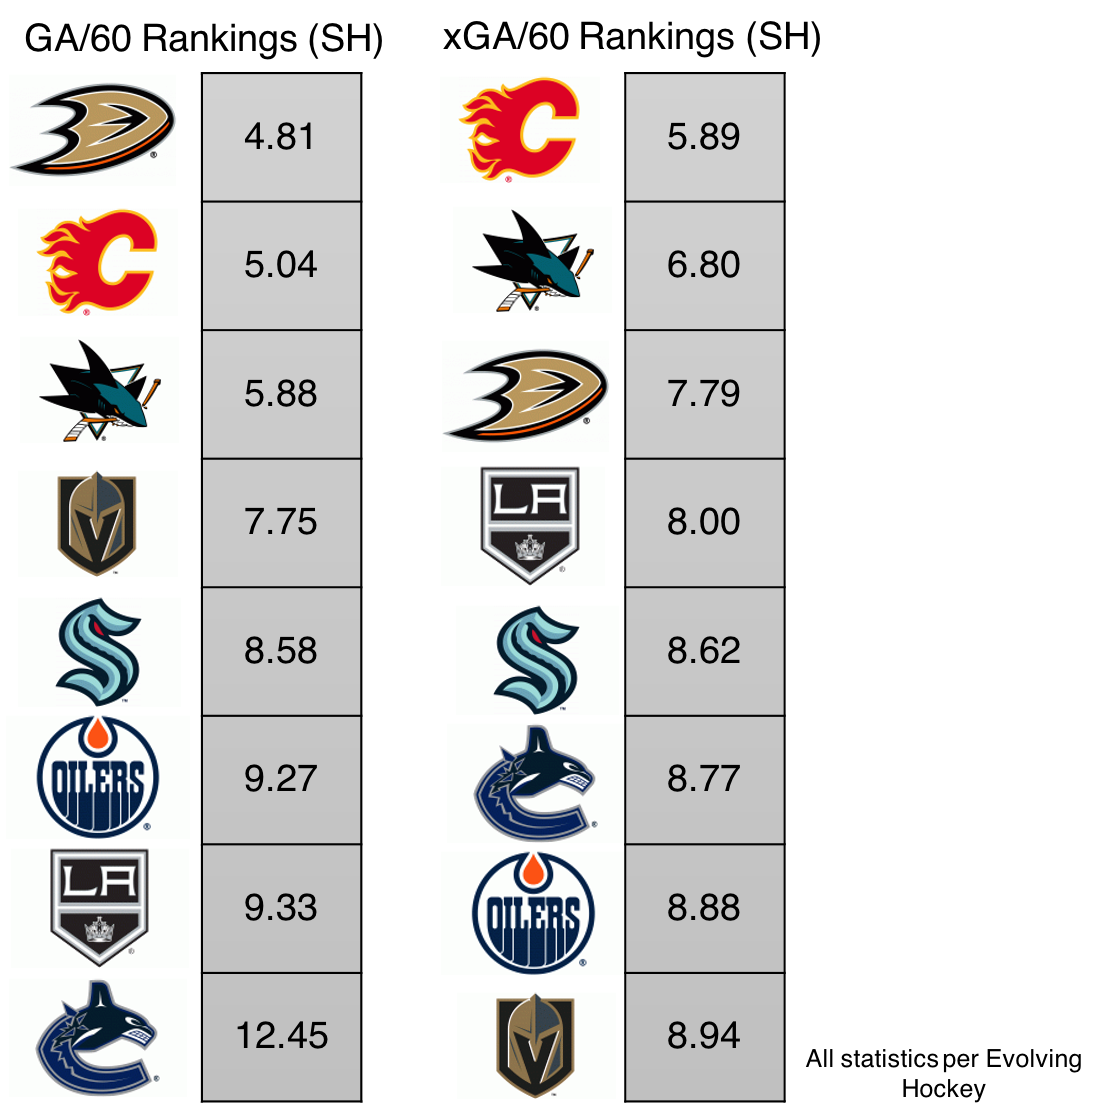
Figure 4 (above) follows a similar format as Figure 3, but instead looks at shorthanded results and underlying performance for each Pacific Division team. The left panel shows team shorthanded rankings for GA/60 (i.e., the total number of powerplay goals each team has actually allowed per 60 minutes), whereas the right panel shows team rankings for xGA/60 (i.e., the expected number of powerplay goals allowed per 60 minutes for each team). If a team ranks higher (lower) in GA/60 than in xGA/60, then they have overperformed (underperformed) relative to expectation while shorthanded this season. From the Ducks’ perspective, they rank 1st in the Pacific Division in GA/60, but only 3rd in the division in xGA/60. This suggests that the Ducks have benefited favorably from factors other than their own on-ice play shorthanded this season.
John Gibson: Shorthanded Superstar
Figure 5 (below) provides a major clue as to why the Ducks’ actual shorthanded performance (1st in GA/60 in the Pacific Division) has exceeded their expected shorthanded performance (3rd in xGA/60 in the Pacific Division).
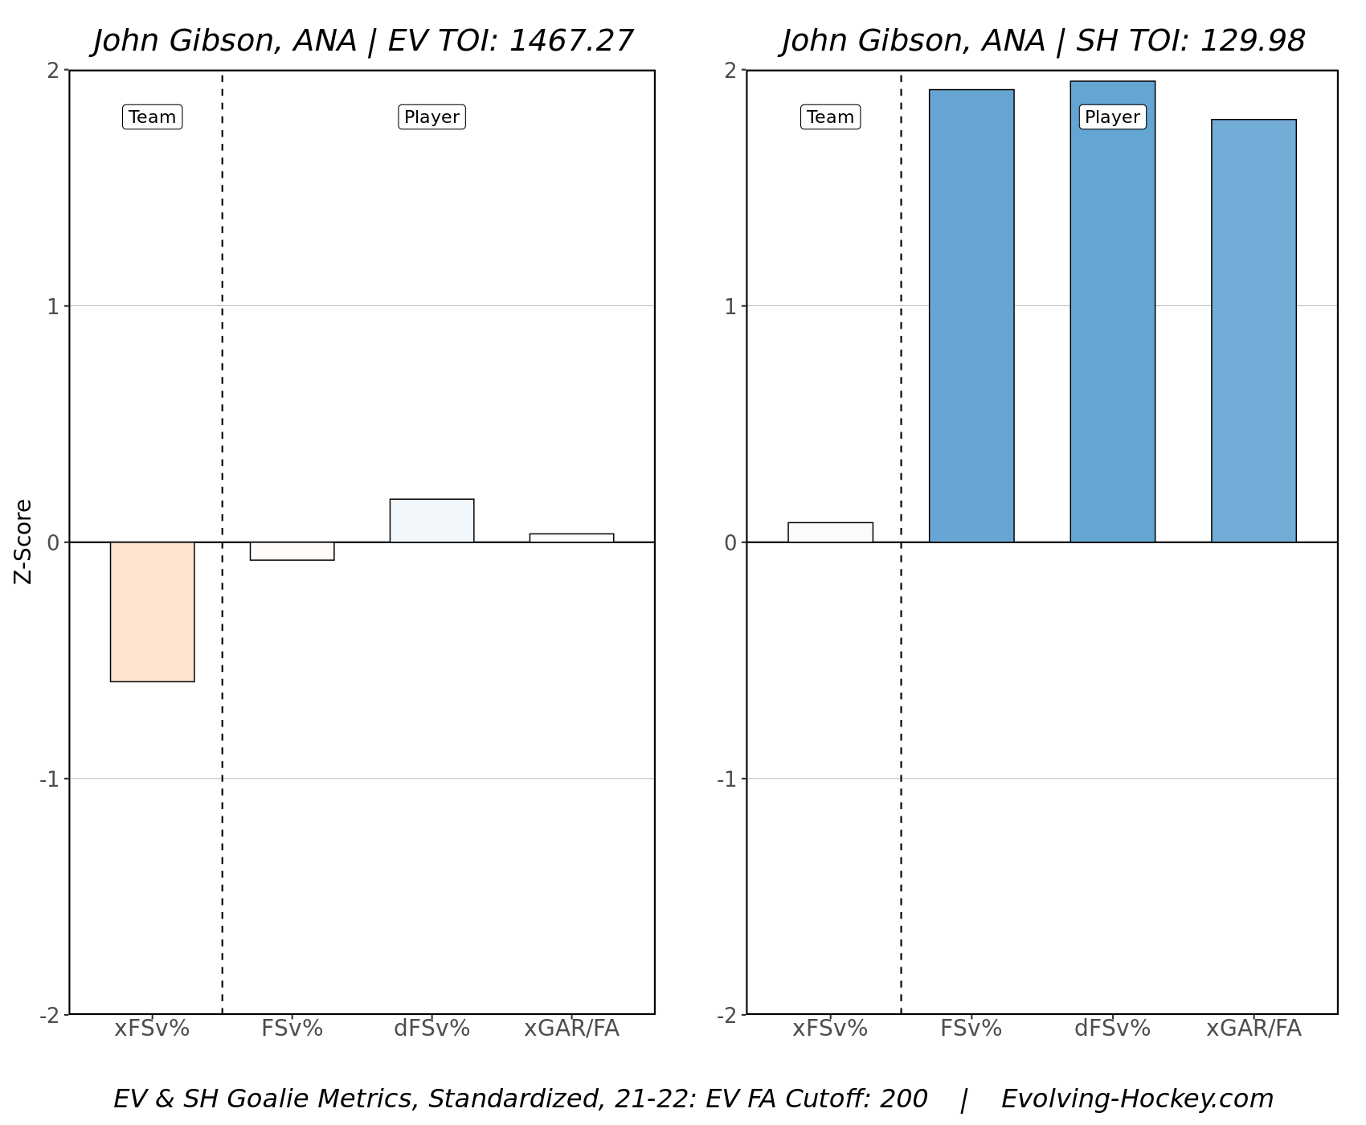
This figure shows Z-scores for several advanced goalie metrics (FSv%, dFSv%, and xGAR/FA) for Ducks goaltender John Gibson this season at both even strength (EV, left panel) and shorthanded (SH, right panel). Z-scores of 0 indicate that a goaltender’s performance has been replacement level for the season relative to the rest of the league. A very interesting picture emerges when assessing Gibson’s EV and SH performance this season. While Gibson has been at-or-near replacement level at EV so far this season (left panel), he has been elite at SH (right panel). This incredible performance by Gibson when the Ducks are killing penalties is very likely a major contributor as to why the Ducks have outperformed expectation on the penalty kill this season (as shown in Figure 4).
Overall Takeaways
In analyzing both the points percentage standings and the underlying on-ice metrics, it is fair to say that the Calgary Flames have been the best team in the Pacific Division thus far during the 2021-2022 season. While Anaheim currently sits comfortably in a playoff position in the Western Conference, their on ice metrics have lagged behind their overall point total, and John Gibson’s elite shorthanded goaltending, along with some puck luck on the powerplay, has helped Anaheim exceed expectations based on their on-ice metrics thus far this season. It will be fascinating to see how these statistics look at the end of the season as the COVID-19 pandemic continues to impact teams less and less, and as all teams converge to the same number of games played on the season.